
Compared to what?
How to avoid misinterpreting import and trade deficit data

The last week brought several retrospective analyses of President Trump’s first year of reciprocal tariffs, ranging from victory laps to selective trend line comparison to careful examination of what’s been learned.
It will take much longer to empirically estimate how the rapidly changing tariff environment is impacting an economy that is also subject to other major policy shocks, geopolitical shocks, and the ongoing AI boom.
In the meantime, we can eyeball charts and attempt to see what trends are changing. That works for answering questions like, “Did investment increase by trillions of dollars this year,” but it cannot tease out the effects of multiple shocks compared to a counterfactual nor can it establish causation. It can also be quite misleading.
Take one of the administration’s preferred metrics: the trade deficit. In early 2025, before the new tariffs had taken effect, firms rushed to import goods before they would be subject to new taxes. This surge in imports lifted the trade deficit in early 2025, and when tariffs later took effect, it allowed firms to temporarily rely on pre-tariff inventories instead of tariffed imports
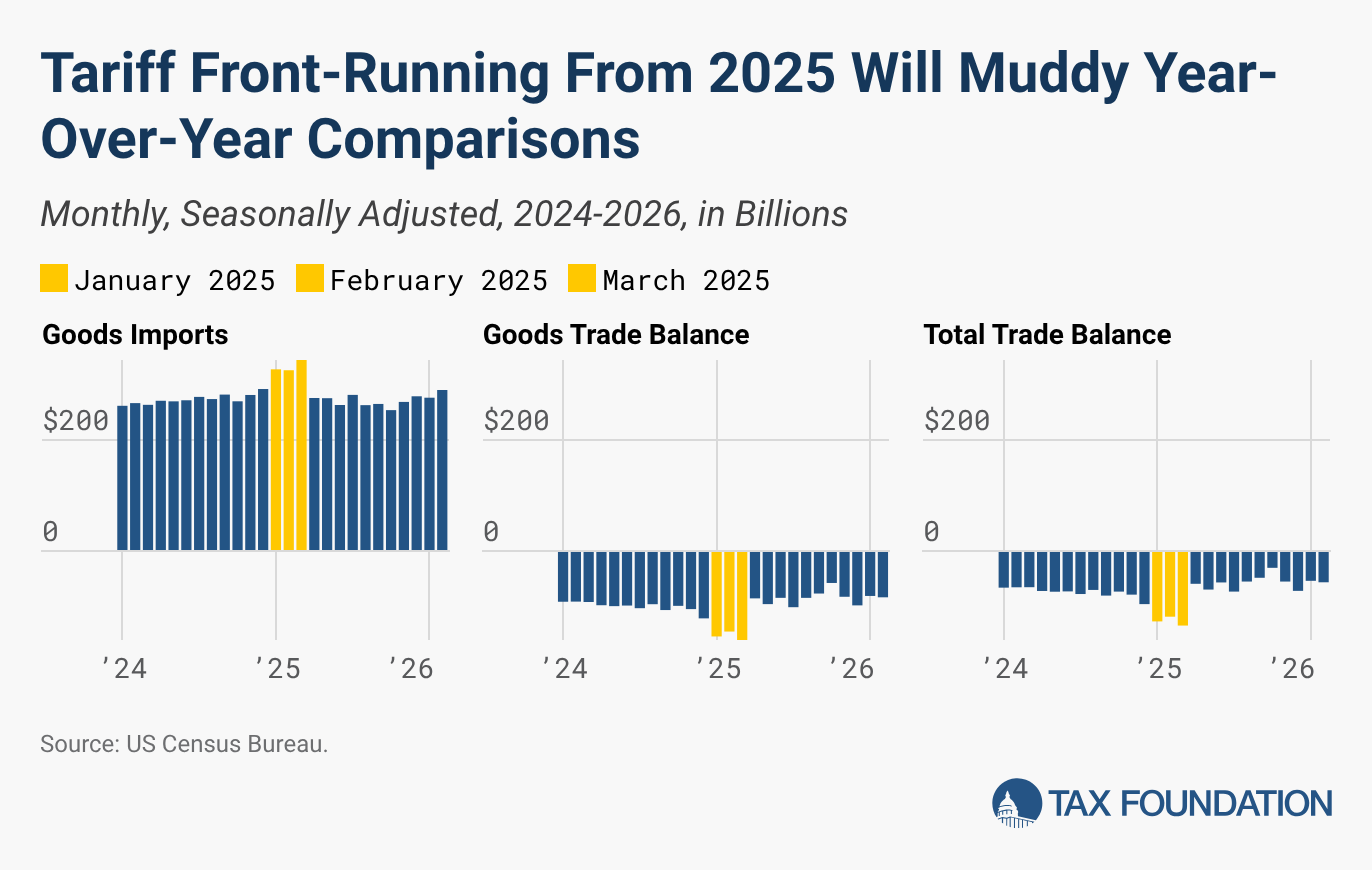
.
Fast forward to the end of 2025 and beginning of 2026, and import patterns have begun to smooth back out. But if one were to compare these relatively stabilized levels now to the temporary import surge in 2025, one could construct a (misleading) story of a major decrease in the trade deficit:
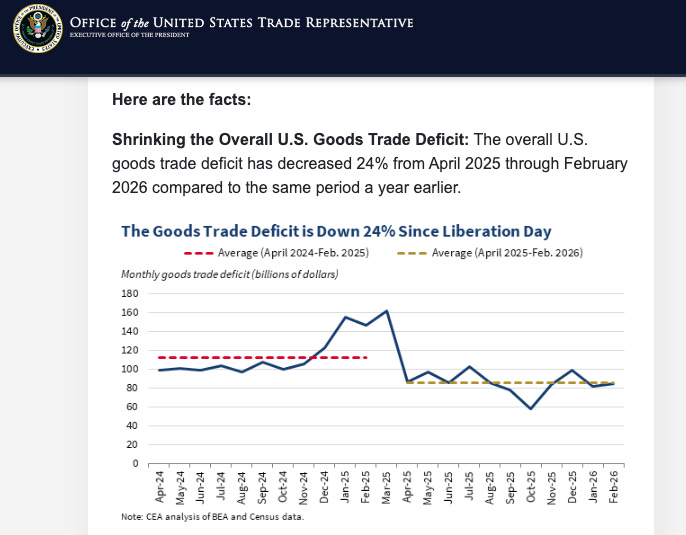
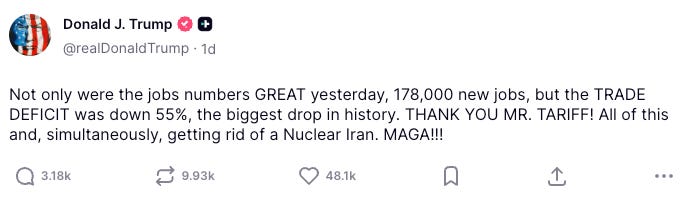
More broadly, operating from an intellectually and internally consistent framework for how a policy shock like tariffs should affect the economy will help guard against misleading interpretations of the data.